

Website Measurement Beyond Pageviews: Events, Enquiries and Outcomes
In short
Measure a website beyond pageviews by starting from the decisions the business makes, then recording the steps that inform them: the visit, the content read, the enquiry, its qualification and the outcome. Track a short list of defined events, treat attribution as an estimate, judge enquiries by quality rather than count, connect them to CRM outcomes, and collect only what privacy rules and consent allow.
Key takeaways
- Reports should explain business actions. A figure that leaves every decision exactly where it was can move off the first page of the report.
- Track a short list of events that mark real buyer steps, such as a successful enquiry or a click to call, each defined once in a written measurement plan.
- Attribution is an estimate made by rule. Use it to compare channels over time, and set it beside what enquirers say about how they found you.
- Count qualified enquiries, not form submissions. A qualification outcome on every enquiry says more about the website than the volume does.
- Pass the source of each enquiry into the CRM, so outcomes can be traced back to the channels and pages that started them.
- Privacy shapes the data. Expect a partial view, keep personal data out of analytics, and collect only what your decisions need.
Table of contents
Most website reports open with traffic: visits, pageviews, bounce rate, time on page, each with an arrow showing whether it went up or down. Then the meeting moves on, because nobody can say what to do differently. Pageviews climb when a post gets shared and dip in the holidays. They rarely tell a business whether the website is bringing in the work it wants.
Useful measurement starts somewhere else: with the decisions the business makes about its website, and the evidence each one needs. Reports should explain business actions. A figure that leaves every decision exactly where it was can move off the first page of the report.
What a website report should help you decide
A website report should help you decide where effort goes next: which pages to improve, which channels to fund, which services to put forward, and whether the enquiries arriving are the ones the business wants. Pageviews answer none of those alone, because they count attention, not intent.
So write the decisions down before choosing a single metric. For a service business the list is usually short: keep or cut a channel, rewrite or leave a page, change the enquiry form, adjust what sales follows up first. Each decision then names the evidence it needs, and that list becomes the measurement plan.
The five steps from a first visit to a business outcome
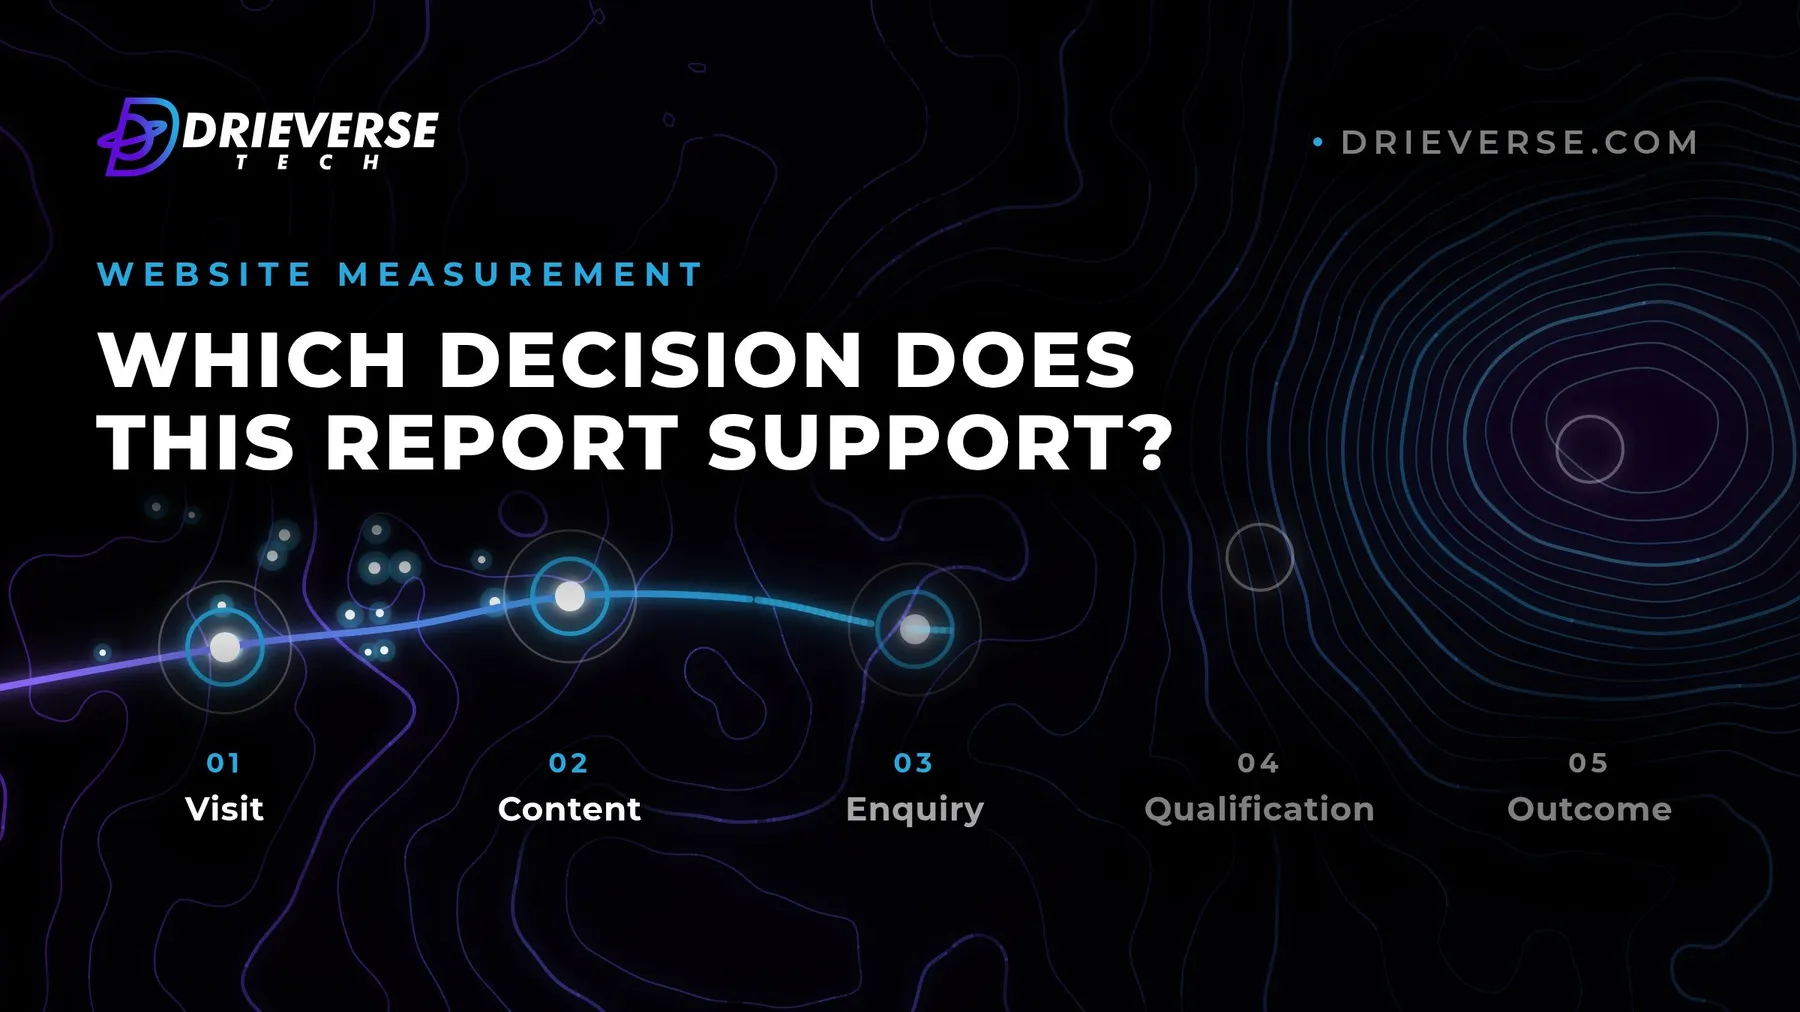
The path from a first visit to a business result has five steps worth recording: the visit, the content read, the enquiry, its qualification, and the outcome. Most analytics setups see the first two clearly, the third partly, and the last two not at all, which is why their reports stop at traffic.
| Step | What to record | Where it usually lives |
|---|---|---|
| Visit | Source, campaign, landing page | Analytics |
| Content | Key pages read, such as a service page or a case study | Analytics |
| Enquiry | Form, call or booking, with its source carried through | Analytics and the enquiry record |
| Qualification | A fit, or the reason it was not | CRM |
| Outcome | Proposal sent, won or lost | CRM |
The break usually sits between the third and fourth steps. Analytics can name the campaign behind a visit, only the sales record can say whether that visitor ever signed anything, and in most setups the two are never joined.
Choose events that mark a real business action
A meaningful event marks a step a buyer takes toward working with you: submitting an enquiry form, tapping a phone number, booking a meeting, downloading a specification, or reaching the quote page. Scroll depth and time on page describe reading. They help when diagnosing one page, but they are not outcomes.
Keep the list short and define each event once. "Enquiry submitted" should fire when the form actually succeeds, not when the button is pressed, and it should mean the same thing on every form. Write each definition into a measurement plan the whole team can read, with the decision it serves beside it. Events that exist only because a tool switched them on by default tend to fill reports that nobody acts on.
Then test them as a visitor would. Send the form, tap the phone link on a mobile, and check that each action is recorded once, with its source attached.
Attribution is an estimate, so report it as one
Attribution assigns credit for an enquiry to the channels a visitor touched before it, and every model does that by rule rather than by observation. Last click credits the final touch, first click the first, and multi touch models spread the credit by formula. None of them can see the conversation at an event, the colleague who recommended you, or the visit on a work laptop before the enquiry from a phone.
Use attribution to compare channels against each other over time, not to settle what caused a single deal. Two habits keep it honest. Ask every enquirer how they heard of you, in a free text field, and set that answer beside the tracked source. And report the share of enquiries with no known source, rather than letting a model quietly hand them to a channel. When that unknown share grows, it is a finding in itself.
Count qualified enquiries, not form submissions
Enquiry quality is the share of enquiries that fit the work the business wants, and it is a better target than the number of forms. A page that doubles its submissions with spam, job applications and supplier pitches has made the report look better and the sales team's week worse.
Agree a small set of qualification outcomes with the people who answer the enquiries: a fit, not a fit with the reason, spam, or not a sales enquiry at all. Record one on every enquiry. After a few months the reasons say more about the website than the volume does. A service page may be drawing the wrong size of client, a form may invite requests the business does not take, or a channel may send plenty of people who never qualify. Handling each enquiry well is its own workflow, set out in our post on the lead follow-up workflow.
Connect website enquiries to CRM outcomes
Connecting the website to the CRM means each enquiry arrives carrying its source, campaign and landing page, so the eventual outcome can be traced back to where it started. Without that link, marketing reports forms, sales reports revenue, and the two never meet.
The connection can be simple. Hidden fields on the form pass the source and landing page into the enquiry record, and the CRM keeps them alongside the qualification and the outcome. A monthly view can then show enquiries, qualified enquiries and won work by channel and by page, which is the view that justifies moving budget.
Two cautions. Sales cycles in many service businesses are long, so this quarter's wins reflect enquiries from months ago: compare like periods. And the CRM view is only as good as its records. An enquiry nobody qualified or closed is a hole in the report.
Privacy and consent in website analytics
Privacy is a design input for website measurement, not a check made after the tags go live. Depending on where your visitors are, analytics and advertising cookies may need consent before they load, and visitors who decline, or who block scripts, do not appear in the numbers at all.
Plan for a partial view instead of treating the totals as complete. Collect the least that answers the decisions on your list. Keep personal data such as names, email addresses and form contents out of analytics events and page addresses; it belongs in the CRM, under its own access and retention rules. Make sure the privacy notice describes what the site actually loads. One record is not affected by any of this: the enquiry itself, which the visitor chose to send, still exists when the cookie banner is declined, even if its source is unknown.
Start each report with the decision it supports
A useful website report opens with the decisions it supports and then shows the evidence for each. Case study pages produce a large share of the qualified enquiries, so the next quarter adds more of them. One paid channel brings plenty of forms but few that qualify, so its budget moves. The traffic charts can sit behind that, for anyone diagnosing a page.
A report built this way is often shorter than the traffic deck it replaces, and it gets argued with, which is the point. If your reports describe traffic but cannot say which enquiries became work, review your website measurement with us: choosing the events, connecting enquiries to outcomes and building reports the business acts on is part of our growth marketing work.
Frequently asked questions
Measure the steps that lead to business results: where visitors came from, which key pages they read, whether they enquired, whether the enquiry qualified, and what it became. Pageviews still help when diagnosing a single page, but a report built on them rarely changes a decision. Start from the decisions the business makes, then choose the few measures each one needs.
A meaningful event marks a step a buyer takes toward working with you, such as a successful enquiry form submission, a tap on a phone number, a booked meeting or a visit to the quote page. Scroll depth and time on page describe reading, not progress. Define each event once, fire it only when the action succeeds, and test it yourself.
Attribution is an estimate. Every model assigns credit by rule, and none can see offline recommendations, conversations at events or visits on another device. It is useful for comparing channels over time, not for proving what caused a single deal. Asking enquirers how they heard of you, and reporting the share with no known source, keeps it honest.
Record a qualification outcome on every enquiry: a fit, not a fit with the reason, spam, or not a sales enquiry. Agree the categories with the people who answer enquiries. Over a few months, the share of qualified enquiries by page and channel, and the reasons the rest did not fit, show far more about the website than the total number of forms.
Pass the source, campaign and landing page into each enquiry as it is submitted, usually through hidden form fields, and store them in the CRM with the qualification and the outcome. A report can then show enquiries, qualified enquiries and won work by channel and by page. Long sales cycles mean comparing like periods rather than this month against last.
Yes. Where consent is required before analytics or advertising cookies load, visitors who decline are not counted, and script blockers remove others. Treat analytics as a partial view, read trends rather than exact totals, and keep personal data out of analytics events. The CRM record of each enquiry still exists when consent is refused, even if its source is unknown.
Have a Growth marketing project like this in mind?
Tell us what you are trying to build. We will tell you plainly what Growth marketing work like this would take.
Get a quoteContact Us
Lahore, Pakistan · London, U.K · Austin TX, U.S · Toronto, Canada